A tool to visualize public money flows
Mar 30, 2016
A post by Nicolas Kayser-Bril of Journalism++
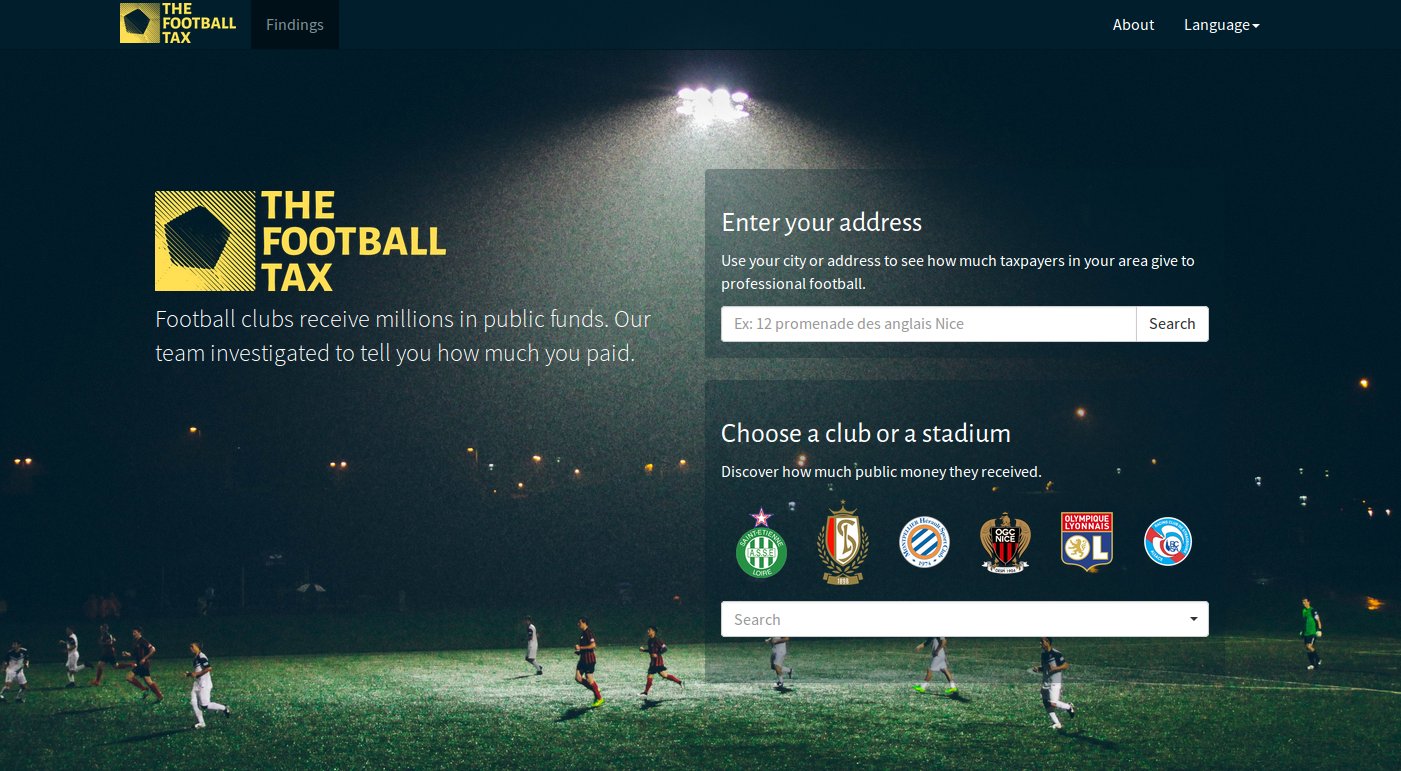
Starting page of The Football Tax.
One of the case study of OpenBudget.eu is The Football Tax, an investigation in public money flows to professional football in Europe. The methodology is straightforward: For each professional club, we look at all layers of public admninistration (city, region, state). For each, we find the payments that were made to the club. Then, we can tell users how much of their tax money went to professional football.
Simple enough, right?
Wrong.
We developed a tool to make it easy for journalists to collect and visualize such messy budget data. Here are the core features.
Geography is harder than it looks
When thinking about levels of government, you probably envision a nice pyramid with the European Union, your country, your region and your city. Think again. The one thing public officials are good at is creating more layers. In France, cities are really run by federations of municipalities, which are unknown to the general public and control most of the money. In Germany, special districts (Zweckverbände) manage large swaths of public funds in education, transport or water management. In the United States, someone can live in up to 10 special districts, in addition to their county and state.
These special districts do not follow a particular hierarchy. They change often. Some are not part of the government, even if they manage billions in public or almost-public funds (the Swiss lotteries, for instance, which are unique in that they are legally responsible for a large part of subsidies given in the country). Mapping such districts and their links would take a lifetime or two.
Instead of mapping out all possible public institutions in Europe, we used a flexible solution. Administrations are defined using a shape (in GeoJSON format). The shape encompasses the territory over which taxpayers contributed to its financing. It’s far from perfect: Some public bodies are only partly funded by taxpayers (public museums, for instance, split their revenues between taxes and entrance fees).
But it works. Users can type in an address, which is geolocalized. The tool looks for all the polygons within which the address falls. The list of public administrations the user contributes to (if she pays taxes at this address) is then displayed.
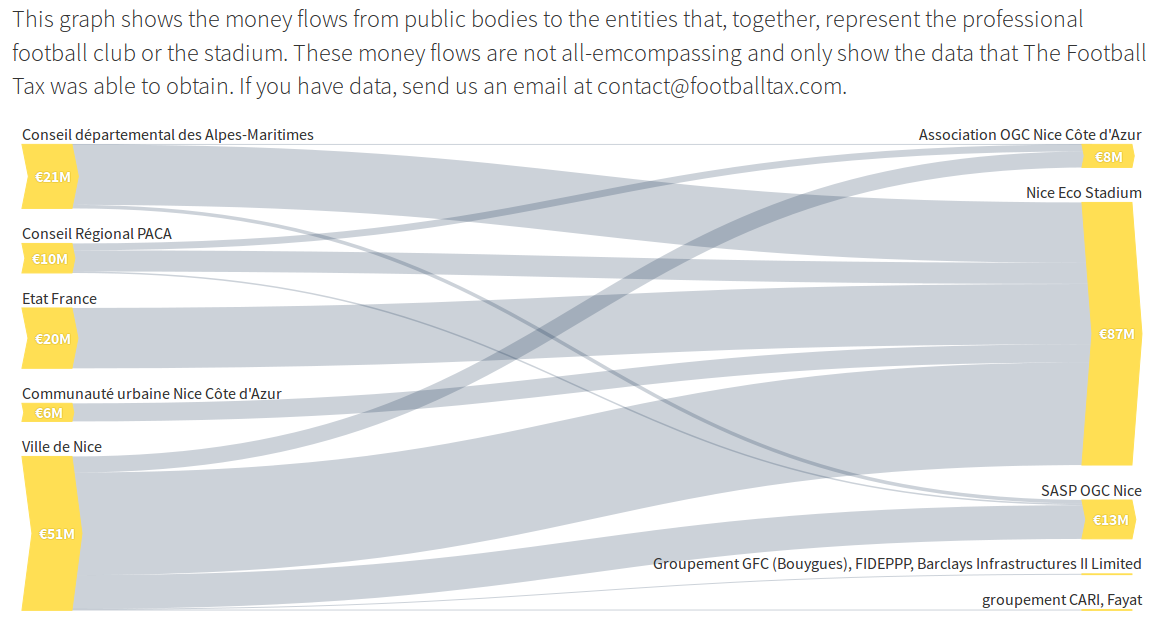
Money flows from public bodies to the football club OGC Nice.
Giving money isn’t always giving cash
Here’s a typical story of mismanagement of public funds. A football club wants to overhaul its stadium. The cost is much higher than what it can afford. A public administration comes to the rescue and agrees to take a loan in the name of the club. The club then reimburses the public administration at a time when its cash reserves allow it to do so. How much money did the public body give the club? (This is a simplified version of the deal struck by Région Nord-Pas-De-Calais for RC Lens in 2012, unearthed during a workshop in Lille, France).
There are no easy answers to such situations. While some money flows are straightforward (a direct subsidy), others are much more subtle. Public authorities can provide a collateral for a loan, for instance. This means that if a club fails to reimburse a loan, the public authority has to pay it back. Public authorities can sell a piece of land to a club under market value. They can provide in-kind services to clubs, such as free rent in public buildings. It would take too long to list all the pack-patting one can do without actually disbursing cash.
In such conditions, having a static list of types of money transfers would be impossible. We investigated about 20 clubs in Europe and are still surprised by the creativity of the deals we uncover. We need to keep our data structure flexible for the future cases we’ll find. To this end, we chose a very simple data structure where “transaction type” remains just text and can be changed in the future.
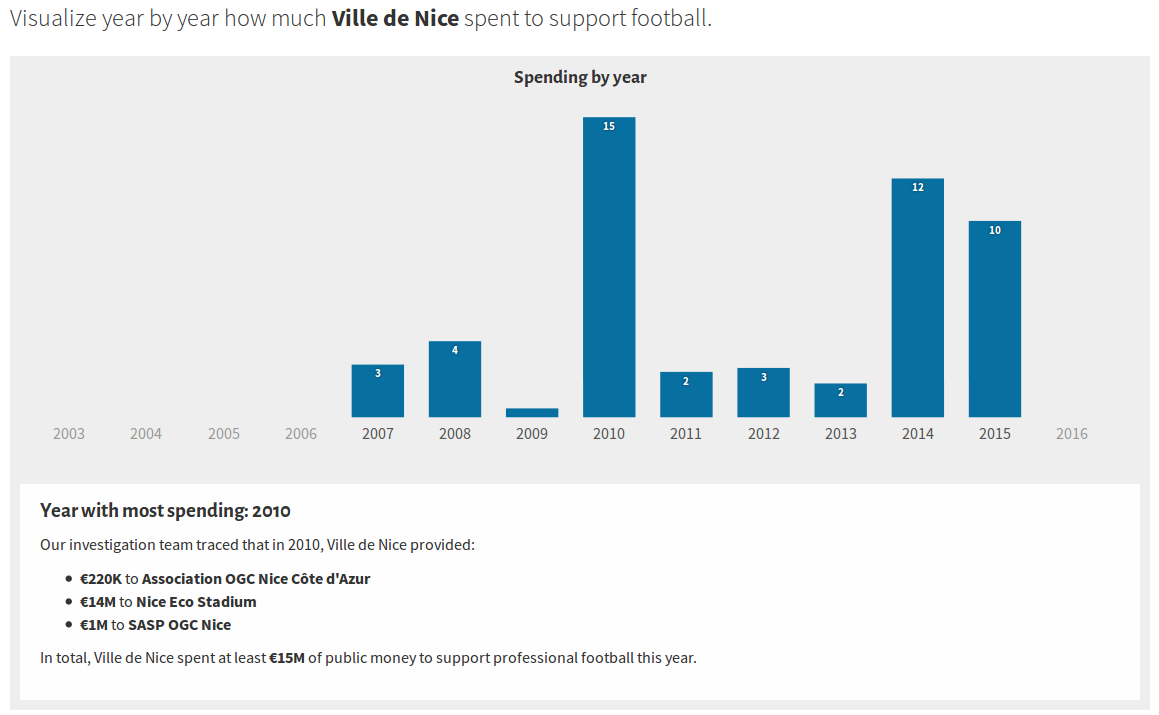
Amounts spent by Ville de Nice on professional football.
Planning ahead
It would be impossible for a single team to analyze all money flows to professional football clubs in Europe. We investigate The Football Tax in workshops and with partner journalists in several countries. We needed a data input interface that was very versatile, flexible (to avoid migrating a database with each change in the data structure) and easy to use. We decided to use Google Spreadsheets. Each club lives in its own spreadsheet. To add data on a club, one just has to create a set of columns (payer, beneficiary and amount) and add the URL of the spreadsheet to a JSON file in the tool.
In the next few months, we will make the tool even more versatile, so that one can easily set it up to investigate any field where different geographical layers, payers and beneficiaries overlap.