Making European Subsidy Data Open
Apr 23, 2017
One month after releasing subsidystories.eu a joint project with Open Knowledge International, we have some great news to share. Due to the extensive outreach of our platform and the data quality report we published, new datasets have been directly sent to us by several administrations. We have recently added new data for Austria, the Netherlands, France and the United Kingdom. Furthermore, first Romanian data recently arrived and should be available in the near future.
Now that the platform is up and running, we want to explain how we actually worked on collecting and opening all the beneficiary data. Subsidystories.eu is a tool that enables the user to visualize, analyze and compare subsidy data across the European Union thereby enhancing transparency and accountability in Europe. To make this happen we first had to collect the datasets from each EU member state and scrape, clean, map and then upload the data. Collecting the data was an incredible frustrating process, since EU member states publish the beneficiary data in their own country (and regional) specific portals which had to be located and often translated.
A scraper’s nightmare: different websites and formats for every country
The variety in how data is published throughout the European Union is mind-boggling. Few countries publish information on all three concerned ESIF Funds (ERDF, ESF, CF) in one online portal, while most have separate websites distinguished by funds. Germany provides the most severe case of scatteredness, not only is the data published by its regions (Germany’s 16 federal states), but different websites for distinct funds exist (ERDF vs. ESF) leading to a total of 27 German websites. Arguably making the German data collection just as tedious as collecting all data for the entire rest of the EU.
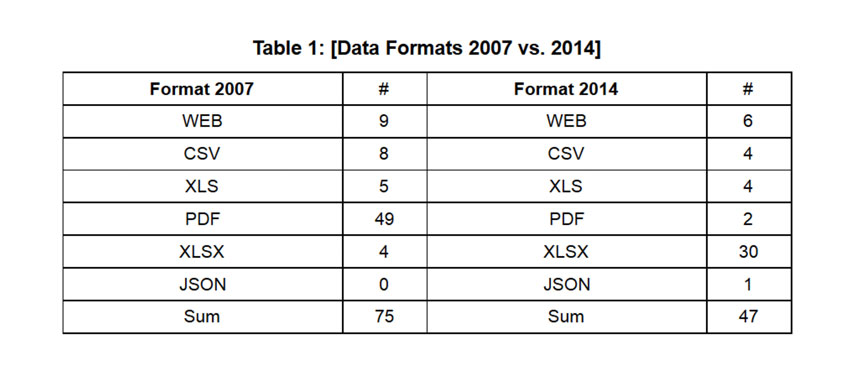
Once the distinct websites were located through online searches, they often needed to be translated to English to retrieve the data. As mentioned the data was rarely available in open formats (counting csv, json or xls(x) as open formats) and we had to deal with a large amount of PDFs (51) and webapps (15) out of a total of 122 files. The majority of PDF files was extracted using Tabula, which worked fine some times and required substantial work with OpenRefine - cleaning misaligned data - for other files. About a quarter of the PDFs could not be scraped using tools, but required hand tailored scripts by our developer.

However, PDFs were not our worst nightmare, that was reserved for webapps such as this french app illustrating their 2007-2013 ESIF projects. While the idea of depicting the beneficiary data on a map may seem smart, it often makes the data useless. These apps do not allow for any cross project analysis and make it very difficult to retrieve the underlying information. For this particular case, our developer had to decompile the flash to locate the multiple dataset and scrape the data.
Open data: political reluctance or technical ignorance?
These websites often made us wonder, what the public servants that planned this were thinking? They already put in substantial effort (and money) when creating such maps, why didn’t they include a “download data” button. Was it an intentional decision to publish the data, but make difficult to access? Or is the difference between closed and open data formats simply not understood well enough by public servants? Similarly, PDFs always have to be created from an original file, while simply uploading that original CSV or XLSX file could save everyone time and money.
In our data quality report we recognise that the EU has made progress on this behalf in their 2013 regulation mandating that beneficiary data be published in an open format. While publication in open data formats has increased henceforth, PDFs and webapps remain a tiring obstacle. The EU should assure the member states’ compliance, because open spending data and a thorough analysis thereof, can lead to substantial efficiency gains in distributing taxpayer money.
