Storyhunt: Uncover the EU - The Workshops
Jul 7, 2017
OpenBudgets.eu and Datenschule organised the Story Hunt this spring: a program for Journalists, Activists, NGOs, Designers, and Coders to dive into EU financial flows. The program was based on the previous work of subsidystories.eu; the data collection project brining together all EU subsidy data. StoryHunt encouraged the participants to take a closer look at the data and find stories and leads. The program consisted of two parts: a workshop series and a weekend long data dive. This blogpost reviews the workshop sessions, our weekend recap can be found here.
#1 Getting Started
In the first workshop we addressed the question “what constitutes a good data-driven project”. Simon Jockers illustrated this question in his talk on the Data Journalism Projects and Practices at the German Newsroom Correctiv. To provide the participants with hands on tools for structuring their own data journalism projects we presented the Data Pipeline methodology that breaks down a data project into seven iterative steps from asking the right question, to finding, getting, cleaning, verifying, analysing and presenting the data.
#2 Asking Questions and Finding Data
The first in any data project - or any research project for that matter - is formulating the right question. A data project has the additional challenge of finding interesting databases that may answer that question. That is why the second workshop focused on the different portals that provide large databases such as the Investigative Dashboard by OCCRP, Cohesiondata EU and OpenCorporates. Concretely, we showed how to automate importing data from websites into Google Sheets using a List of EU Politicians that transitioned into lobbying after public service.
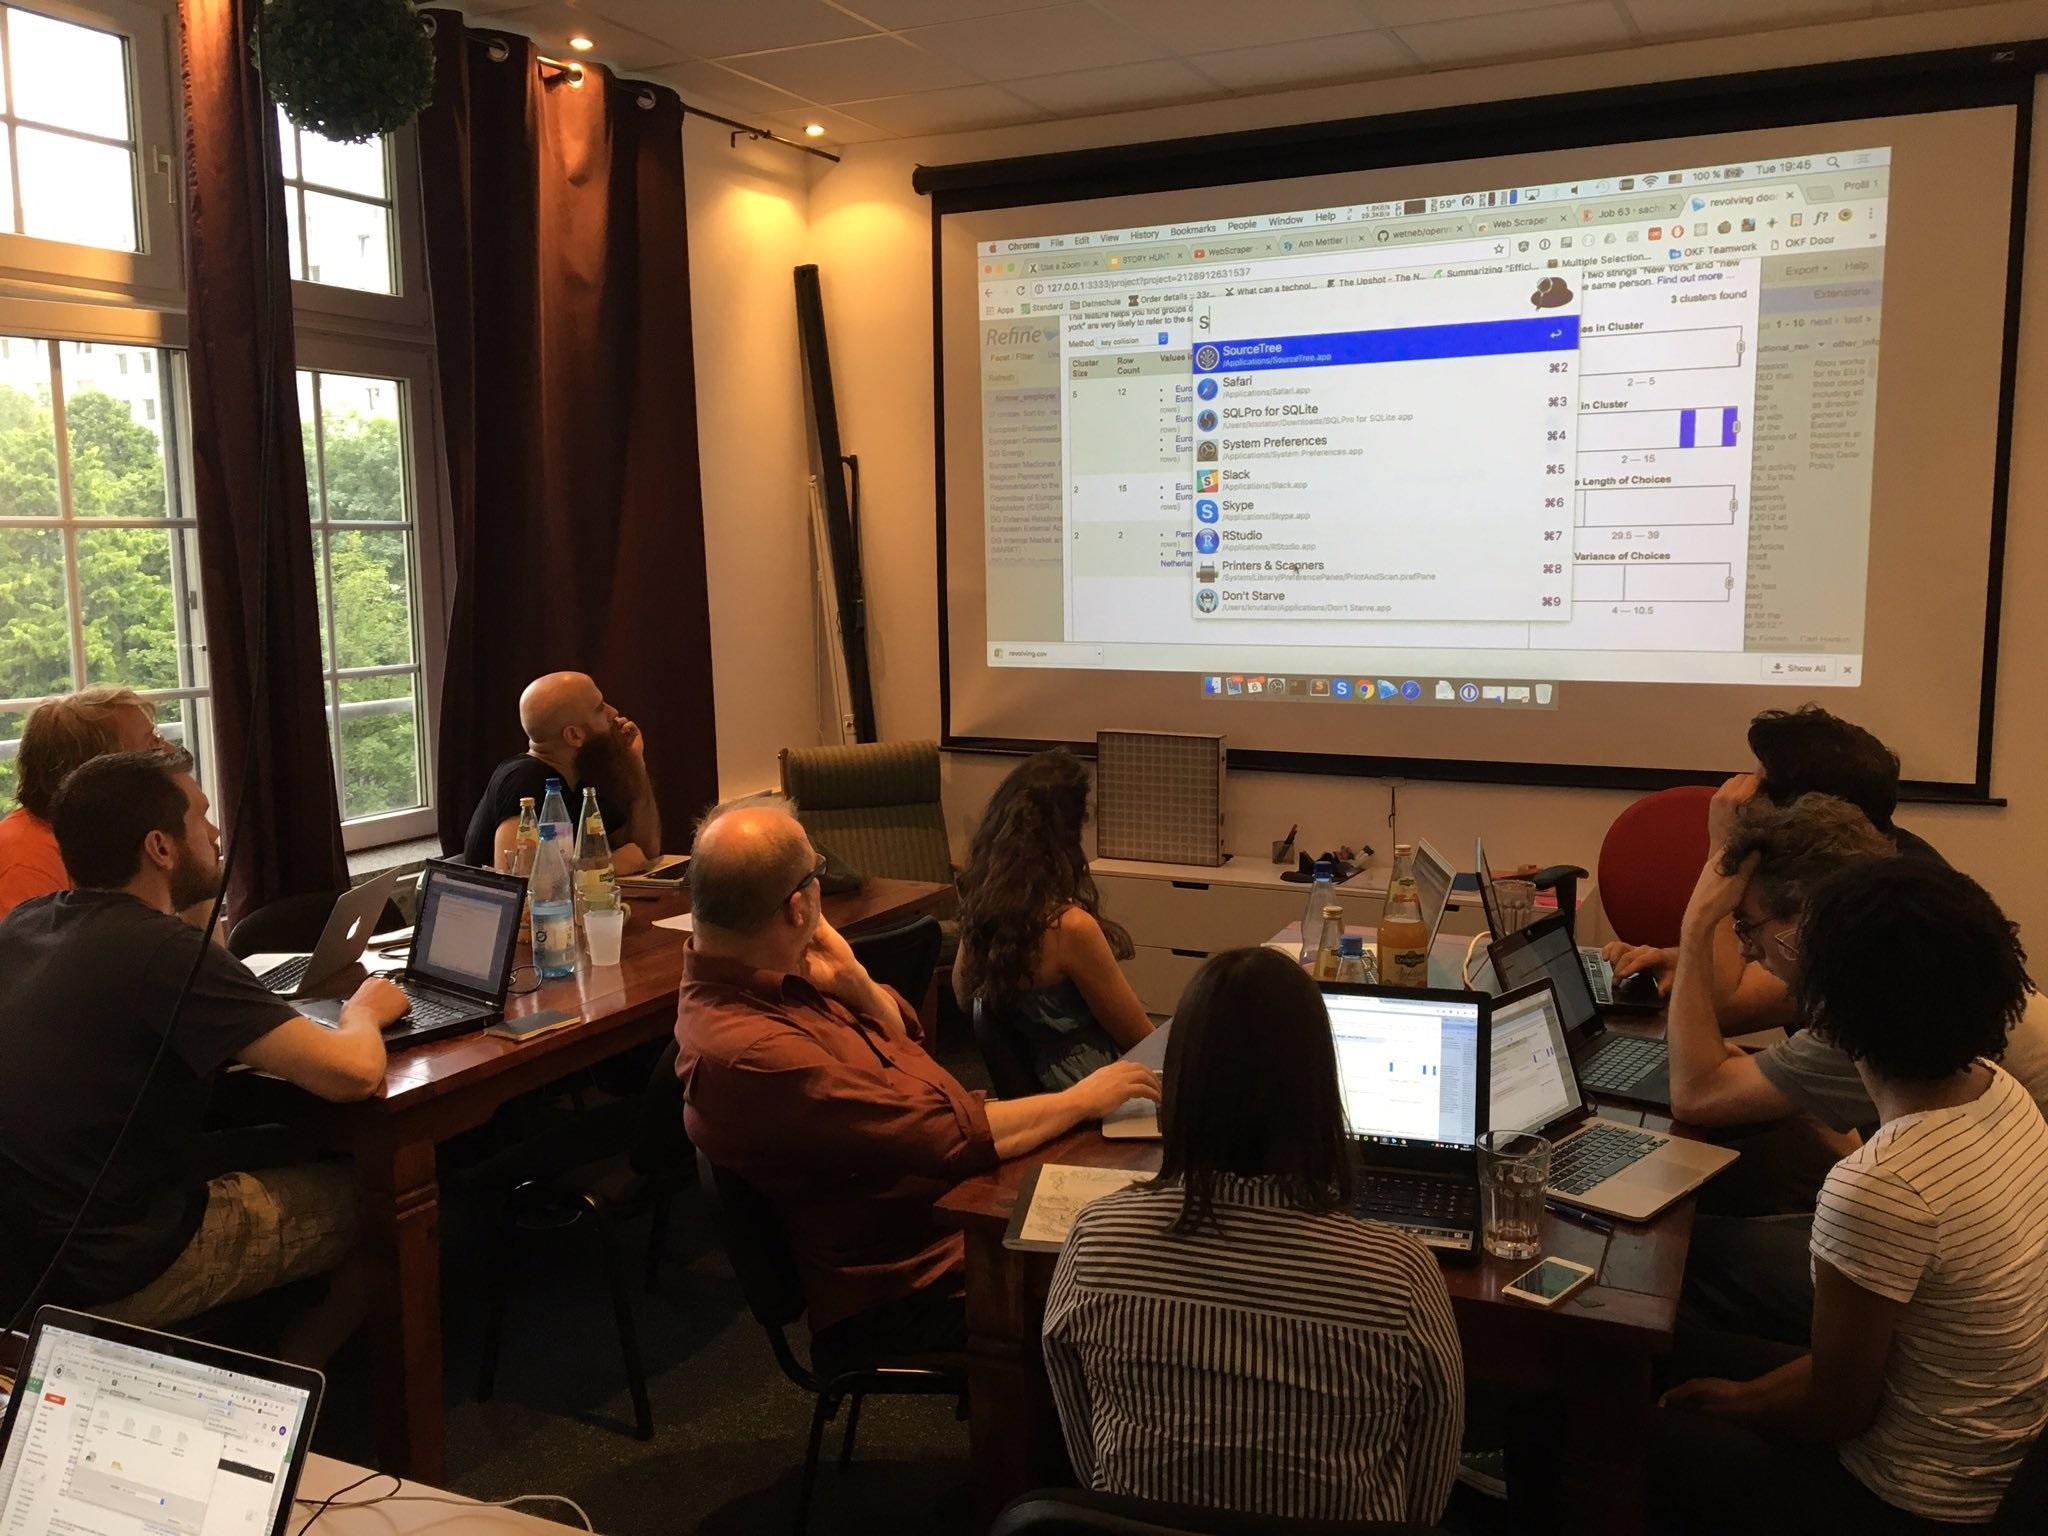
#3 Scraping and Cleaning Data
Data does not always come in optimal machine-readable formats making its use difficult at times. Therefore, the third workshop focused on how to get the data from non-machine readable formats and webpages. This is called “Scraping” and is meant to avoid laborious copy-pasting efforts by using programs and plugins to extract data from its original format or webpage. We taught how to do same web-scraping with the webscraper plugin for the Google-Chrome browser. In most cases scraping turns out data that requires cleaning and transforming, which is why we introduced the Online-Tool Open Refine. The tool is ideal for cleaning data and enriching the informational value. An overview on Open Refine’s functions can be found here .
#4 Analytics: Intro into Basic Statistics & Spreadsheets
Financial data is hard to grasp, but often entails inspiring stories as the Panama Papers or LuxLeaks have recently shown. However, it is important to have a fundamental knowledge of the data and that requires knowledge of statistics. Verena Pflieger of INWT Statistics gave a short introduction into statistical concepts, such as causation and correlation, demonstrating the latter with a nice game “GuesstheCorrelation”. In the second part we took this into practice and looked at the European Structural and Investment Funds (ESIF) Database and analyzed this in Google Sheets answering questions about range, maximum, minimum, and comparisons by asking for example which EU member state have received the highest subsidies or how much of their Gross Domestic Product (GDP) do subsidies account for.
#5 Visualising Data
In order to tell a story with data it is important to be able to properly visualize it. In our last workshop Data-Viz expert Lisa Rost showed us the Do’s and Don’t’s of data visualization and gave an introduction to the Online-Tools RAWGraphs and Datawrapper. We practiced again with the previously enhanced financial data and the participants created a map that showed which country receives the highest amount of EU-Subsidies in relation to their GDP, with Poland at the top of the list with 3%.
All our presentations and the datasets used in the workshops can be found in our Github repo.